PowerPivot - Choosing a calculated column type
 Lately I have been using PowerPivot (more details on this at the end of this post) and I came across a problem whose solution might interest others.
The Problem
As I created a calculated column based on a date column, the result was always displayed as a number instead of a date. Worst the drop down list where you can choose the type of the column was greyed out.
Here is an example; CalculatedColumn1 is created using some number function (ROUNDDOWN). Yet I am working with Dates, while PowerPivot understandably consider the results to be a number, one can’t override this automatic setting of the Data Type. The “Data Type” DropDown list is just greyed out with a value of Number (Nombre in French in the screenshot below) :
 The obvious drawback is that my column isn’t very readable, I mean no normal human beings can understand that 40255 mean 18/03/2010 00:00, else leave me a comment, I would be interested to meet you :)
My solution
Here is my workaround, just throw a date function in your function. In my case I choose to add TIME(0,0,0) which is a neutral operation :
 Thus PowerPivot will understand that your column is a date, and you will be able to select a Date format:

Some Information on PowerPivot (aka Gemini)
For those who don’t know what PowerPivot is, you might know by its codename, Gemini. It is a Microsoft Addin for Excel and SharePoint 2010 that allows you to analyze tons of data very easily. It’s supposedly really fast due to its in In Memory Analysis. For BI noobs (a group I am sadly part of) you might see it as a personal version of Anaysis Service (PowerPivot for Excel) or as a Team flavored BI (PowerPivot for SharePoint), on this subject I found this blog post by the PowerPivot Team very interesting (http://blogs.msdn.com/powerpivot/archive/2010/03/12/comparing-analysis-services-and-powerpivot.aspx). Microsoft released a series of nice videos to explain PowerPivot, here is the first one : Here is what PowerPivot promises and, as far as my experience went, delivers:
- Analysis (Pivot Table and graph) of Data from multiples sources (DataBase, Excel files, flat files)
- Analysis of huge volume Data (I am talking millions here)
- Integration of simple relational constraint between your data sources
- And maybe the coolest part is that this is available to any Information Worker already familiar with Excel. I would take this one with a grain of salt; your Information Worker needs to be quite technical savvy to fully benefit from this tool.
Additionally the Integration with SharePoint is supposed to bring added performance and to deliver your reports more easily to multiple persons. I haven’t tested the integration, yet! After spending some quality time with PowerPivot I have got to admit being very enthusiastic about this product. I can see numerous scenarii where it would have saved me hours in the past (More details and cool links at the end of the post). I just can’t wait to set my hands on the RTM version of Excel 2010 and PowerPivot to enjoy this tool without worrying so much about the too frequent crashes (in my experience double clicking on a graph horizontal axis freezes quite often). To go further I would advise you to start with the official PowerPivot site (http://www.powerpivot.com ), especially the demo part. To my French reader I would also recommend the hilarious BI video by Têtes à Claques that you might have enjoyed at the 2010 Techdays in Paris :(http://www.microsoft.com/france/serveur/sql/secretedouard/ )


 I was recently developing a Comments & Rating SharePoint solution. As postbacks were forbidden (for good reasons, who loves postbacks ?), we used
  I will not cover the basics of making your web service JSONP compliant, other bloggers have done a great job at that ( I would recommend
  Once everything was it in place I started to test the Web Service and everything was going fine. But as I started to push more and data, at one point the web service started not to work anymore. As soon as the Web Service had less data to return it would works again.
To check what was going wrong, I fired up
Once everything was it in place I started to test the Web Service and everything was going fine. But as I started to push more and data, at one point the web service started not to work anymore. As soon as the Web Service had less data to return it would works again.
To check what was going wrong, I fired up  Simple enough for my problem to go away, moreover it meant less code to maintain in the future.
If needed, it is possible to add a switch to make it SOAP and straight JSON compliant, if no callback parameter is given it wouldn’t do anything to the response. It would only take a couple more lines.
Simple enough for my problem to go away, moreover it meant less code to maintain in the future.
If needed, it is possible to add a switch to make it SOAP and straight JSON compliant, if no callback parameter is given it wouldn’t do anything to the response. It would only take a couple more lines. It could have ended like that, a running ASP.Net JSONP compliant Web Service, but it didn’t. Keeping testing the web service with more and more data, I hit another point where the Web Service seemed not to work.
Once again, I called my good friend fiddler for help. It soon became apparent that the server would only return 500 responses.
It could have ended like that, a running ASP.Net JSONP compliant Web Service, but it didn’t. Keeping testing the web service with more and more data, I hit another point where the Web Service seemed not to work.
Once again, I called my good friend fiddler for help. It soon became apparent that the server would only return 500 responses.
 Http 500 status code means that an
  Yet I have to admit being upset when I found out the solution to my problem, the fact no error messages where logged anywhere I could found them. How are we supposed to diagnose our problem when the only error message is a 500 Http Error code?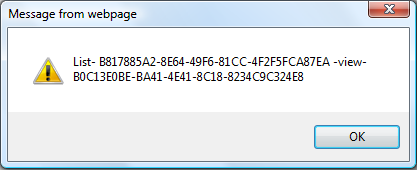
 Drag and drop this link (
 Drag and drop this link (